Enterprise network infrastructure demands have accelerated dramatically as organizations deploy AI workloads, cloud-native applications, and distributed computing architectures. Between 2023 and 2024, bandwidth purchased for data center connectivity surged 330%, according to Zayo's 2024 Bandwidth Report, with fiber count in metro deployments increasing over 600%. This explosive growth forces enterprises to reconsider their structured cabling approach, particularly regarding multi-fiber connectivity solutions. The mtp trunk cable has emerged as a crucial component in addressing these density challenges, yet selecting the appropriate configuration requires balancing immediate requirements against long-term scalability objectives.

Enterprise-Grade MTP Trunk Cable Selection: Core Value Framework
The fundamental value proposition of deploying mtp trunk cable infrastructure in enterprise environments centers on three interconnected benefits that directly impact operational efficiency and financial performance. Understanding these core advantages enables informed infrastructure decisions rather than reactive technology adoption.
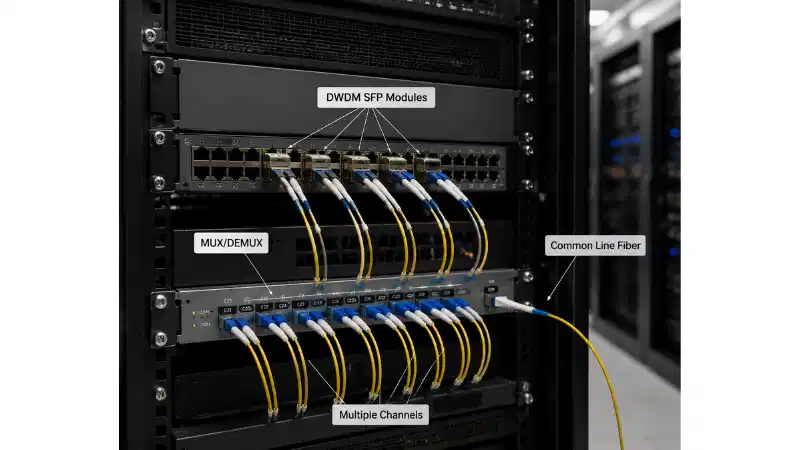
Density optimization represents the most immediate benefit. A single 24-fiber MTP trunk cable consolidates what would otherwise require twelve traditional duplex LC patch cords. This 12:1 consolidation ratio translates to measurable improvements in cabinet space utilization and airflow management. Enterprises operating colocation facilities face direct cost implications-each rack unit (RU) of recovered space represents approximately $1,200-2,400 annually in avoided costs across major metropolitan markets, based on 2024 Statista colocation pricing data.
Deployment velocity creates competitive advantage through reduced implementation timelines. Factory-terminated trunk cables eliminate field splicing requirements, cutting installation time by 60-70% compared to traditional fiber termination methods. For a mid-sized enterprise deploying 100Gbps connectivity across a 30-rack facility, this acceleration can compress project timelines from 6-8 weeks to 2-3 weeks. The labor cost differential alone often justifies the premium for pre-terminated solutions-field termination labor typically costs $15-25 per connector, while factory termination adds only $3-5 per connector to cable costs.
Scalability assurance protects infrastructure investments against technology evolution. MTP trunk cables support migration from current 100G deployments to 400G and beyond without physical cabling changes. The fiber plant remains constant while only active equipment upgrades. This future-proofing characteristic becomes crucial when examining total cost of ownership over typical 7-10 year infrastructure lifecycles. A BCG infrastructure analysis found that organizations deploying structured pre-terminated solutions experienced 40% lower total migration costs during technology transitions compared to point-to-point cabling approaches.
The interplay of these three value drivers creates a compelling business case, but only when the selected trunk cable configuration aligns precisely with enterprise-specific requirements. Misalignment in fiber count, connector polarity, or fiber mode leads to stranded capacity or premature obsolescence-both costly outcomes that undermine the initial value proposition.
Fiber Density Alignment with Network Growth Patterns
Matching trunk cable fiber count to organizational growth trajectories requires analyzing current utilization alongside projected expansion. Many enterprises default to 12-fiber configurations based on immediate needs, only to face premature capacity constraints within 18-24 months. A structured assessment methodology prevents this common planning failure.
Current state analysis begins with documenting existing port density across network layers. Core switches in enterprise environments typically operate at 100G or 400G speeds, while distribution switches run at 10G, 25G, or 100G, and access layers predominantly deploy 1G or 10G connectivity. Each speed tier consumes different fiber quantities. A 100G SR4 transceiver requires 8 fibers (4 transmit, 4 receive), while 400G SR8 connections demand 16 fibers. Organizations should calculate total fiber consumption across all planned connections, then apply a 30% overhead buffer to account for redundancy and measurement uncertainty.
For enterprises operating 50-150 server racks, analysis of deployment patterns reveals instructive benchmarks. A typical pod architecture serving 20 racks with dual-attached 100G top-of-rack switches requires 320 fibers for server connectivity alone (20 racks × 2 switches × 8 fibers per 100G connection). Adding spine layer redundancy increases fiber requirements by another 25-35%. These calculations drive trunk cable selection toward 24-fiber or 48-fiber configurations for backbone infrastructure, while 12-fiber trunks remain appropriate for edge distribution.
Growth projection modeling extends the analysis forward across a 3-5 year planning horizon. Historical data from enterprise network expansions indicates that organizations typically experience 40-60% compound annual growth in fiber port requirements during periods of digital transformation. A telecommunications services company based in Chicago implemented this analysis approach in 2023. Operating 85 racks across two facilities, their initial assessment revealed 1,240 active fiber connections. Projecting 50% annual growth (conservative for their industry), they calculated requirements of 2,790 fibers by 2026. This forecast informed a decision to deploy 72-fiber trunk cables between data halls, despite current utilization suggesting 48-fiber cables would suffice. By mid-2024, their actual fiber consumption reached 2,100 connections-validating the projection model and preventing a costly mid-cycle recabling initiative.
Breakout ratio optimization determines the appropriate balance between high-density trunk cables and individual duplex connectivity. Enterprises deploying parallel optics (40G/100G/400G) in core and distribution layers benefit from maintaining MTP connectivity throughout the structured cabling system, using breakout cables only at access layer transition points. This approach minimizes insertion loss accumulation and simplifies polarity management. Conversely, organizations with predominantly 10G infrastructure may find that MTP-to-LC breakout cables provide optimal flexibility, allowing gradual migration to higher speeds without wholesale infrastructure replacement.
A financial services firm with 120 racks deployed a hybrid strategy combining 48-fiber MTP-to-MTP trunk cables in the backbone with 24-fiber breakout assemblies at each rack. This configuration supported their immediate 25G storage network requirements while providing capacity for future 100G server connectivity. The total implementation cost of $78,000 for structured cabling compared favorably against $65,000 for a point-to-point approach, with the $13,000 premium justified by eliminating future recabling expenses estimated at $120,000-150,000.
Fiber count selection ultimately balances initial capital expenditure against operational flexibility and future upgrade costs. Under-provisioning forces premature reinvestment, while over-provisioning ties up capital in unused capacity. The analytical framework above enables enterprises to identify the optimal balance point specific to their growth trajectory and technology adoption patterns.
Infrastructure Compatibility Assessment Criteria
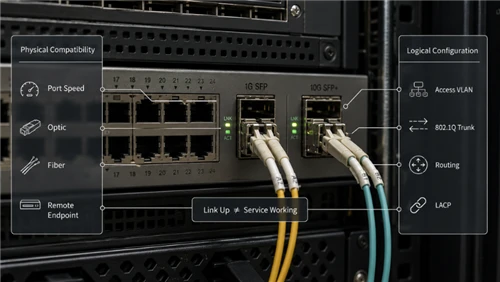
Technical compatibility represents a critical but frequently misunderstood dimension of mtp trunk cable selection. Seemingly minor specification differences create significant operational consequences, from complete connection failures to subtle performance degradation that manifests only under peak load conditions.
Fiber mode alignment forms the foundation of compatibility planning. Single-mode fiber (OS2) supports transmission distances up to 10 kilometers at 100G speeds, making it appropriate for campus connectivity and inter-building links. Multi-mode fiber variants-OM3, OM4, and OM5-serve intra-building connections with distance limitations of 100 meters (OM3), 150 meters (OM4), or 150 meters (OM5) at 100G speeds. The distance-speed relationship follows inverse proportionality: higher speeds reduce maximum distances. Organizations must map required link distances against supported speeds to determine appropriate fiber mode.
A common error occurs when enterprises inherit existing OM3 infrastructure and attempt to overlay 400G connectivity. While OM3 supports 400G SR4.2 transmission, the maximum distance shrinks to just 70 meters-insufficient for many building geometries. Upgrading to OM4 extends reach to 100 meters, but achieving 150-meter distances requires OM5 fiber. These constraints directly impact trunk cable selection and often necessitate mixed-mode deployments where inter-building links deploy OS2 single-mode trunk cables while intra-building distribution relies on OM4 multi-mode solutions.
Polarity management prevents costly connection errors that can render entire trunk cable installations non-functional. MTP connectors implement three standard polarity methods (Type A, Type B, Type C), each designed for specific network architectures. Type B polarity, employing key-up to key-down orientation, aligns with parallel optics transceivers and dominates enterprise deployments. Type A requires polarity reversal at patch panels, while Type C flips fiber positions within the connector body.
Mismatched polarity creates situations where physical connections appear correct but no light transmission occurs. A professional services company in Boston experienced this precise failure during a 2024 data center migration. Their networking team ordered Type A trunk cables based on legacy documentation, but newly acquired switches required Type B polarity. The resulting incompatibility delayed the cutover by three weeks while replacement cables were sourced and installed. Total impact: $87,000 in extended colocation fees, consultant overtime, and lost productivity. Rigorous polarity specification verification prevents such failures.
Connector end-face geometry affects insertion loss and return loss performance. MTP Elite connectors, manufactured by US Conec, incorporate tighter mechanical tolerances than generic MPO connectors, typically achieving insertion loss values of 0.25dB versus 0.35dB for standard MPO connectors. While this 0.10dB difference appears marginal, it accumulates across multiple connection points. A trunk cable with four mated pairs (eight total connections) exhibits 0.80dB additional loss with standard MPO versus MTP Elite connectors-potentially the difference between meeting and exceeding IEEE 802.3 optical power budget specifications for 400G links.
Government procurement standards increasingly mandate MTP Elite or equivalent performance specifications. A Department of Defense facility upgrade in 2024 required all trunk cables to demonstrate ≤0.30dB average insertion loss per connection. This specification effectively required MTP Elite or equivalent connectors, as generic MPO solutions could not reliably achieve the performance threshold. Enterprises should evaluate whether their applications justify the 15-20% cost premium for Elite-grade connectors based on link budget analysis and performance requirements.
Cable jacket ratings align with building safety codes and installation environments. Plenum-rated (OFNP) cables meet stringent fire safety requirements for air-handling spaces but cost 25-30% more than riser-rated (OFNR) alternatives. Many enterprises default to plenum specifications for all installations to simplify inventory management and ensure code compliance, accepting the cost premium as insurance against future building modifications. Outdoor-rated cables incorporate additional moisture barriers and UV protection, necessary for campus deployments but inappropriate for indoor applications due to reduced flexibility and increased diameter.
Compatibility assessment requires cross-referencing multiple technical specifications against existing infrastructure and planned equipment deployments. Creating a detailed compatibility matrix documenting fiber mode, polarity type, connector specifications, and jacket ratings for each network segment prevents the specification errors that create expensive project delays.

Total Cost of Ownership Analysis
Financial evaluation of MTP MTP Cable and other mtp trunk cable alternatives extends beyond purchase price to encompass installation labor, maintenance requirements, and lifecycle considerations. Organizations that optimize solely for lowest initial acquisition cost frequently experience higher total expenses over 5-7 year operational periods.
Acquisition cost modeling starts with per-fiber pricing analysis. Bulk fiber pricing for 12-fiber trunk cables typically ranges from $3.50-6.00 per meter for OM4 multimode configurations, while 48-fiber assemblies cost $8.00-12.00 per meter-reflecting roughly linear scaling with fiber count. Single-mode OS2 cables command 20-30% premiums over equivalent multimode configurations. However, these base prices fluctuate based on order quantities, delivery timelines, and vendor relationships. Organizations sourcing 50+ trunk cable assemblies often negotiate volume discounts of 15-25% below published list prices.
Connector quality grades create another pricing dimension. Standard MPO connectors add $12-18 per end to cable costs, while MTP Elite connectors increase costs to $18-25 per end. For a 48-fiber trunk cable with connectors at both ends, this differential represents $24-56 per cable-manageable for small deployments but significant when multiplying across 200-300 trunk cables in a large facility installation.
Installation labor costs dwarf material expenses in many enterprise deployments. Skilled fiber technicians command hourly rates of $75-125 depending on geographic region and certification levels. Installing pre-terminated trunk cables requires 0.5-0.8 hours per cable including routing, securing, and documentation. Field termination of equivalent fiber counts consumes 4-6 hours per cable including splicing, testing, and documentation. For a 100-cable deployment, this differential represents 350-550 hours of labor-translating to $26,000-69,000 in installation cost savings that typically exceeds the entire material budget.
A regional accounting firm upgrading connectivity across three offices conducted detailed cost analysis comparing pre-terminated versus field-terminated approaches. Their 75-rack deployment required 180 trunk cable assemblies. The pre-terminated solution cost $94,000 for materials and $32,000 for installation labor (384 hours). The field-terminated alternative priced at $71,000 for materials but $108,000 for installation labor (1,260 hours). Total costs: $126,000 versus $179,000-a $53,000 savings favoring pre-terminated despite higher material costs.
Operational efficiency impacts generate ongoing value throughout the infrastructure lifecycle. Structured trunk cable deployments enable faster troubleshooting through simplified signal paths and reduced connection points. Each eliminated connection point removes potential failure sources and reduces mean time to repair (MTTR). Industry data suggests structured cabling reduces average troubleshooting time by 40-50% compared to point-to-point installations. For enterprises where each hour of network downtime costs $50,000-100,000 in lost productivity and revenue, faster restoration capabilities deliver substantial value.
Maintenance requirements differ significantly across cable types. Pre-terminated factory assemblies undergo rigorous quality testing including interferometry inspection of connector end-faces. Field-terminated connections depend on technician skill and environmental conditions during installation. Statistical analysis of connection reliability shows factory terminations achieve 99.7% first-time success rates versus 94-96% for field terminations. The 3-5% defect rate in field terminations manifests as "dirty fiber" issues requiring cleaning or re-termination-consuming technician time and potentially causing service disruptions.
Lifecycle upgrade costs complete the TCO analysis. Trunk cable infrastructure supporting 100G today must accommodate 400G tomorrow and 800G within 3-5 years. Organizations deploying appropriate fiber infrastructure (OM4/OM5 multimode or OS2 singlemode) can achieve these upgrades through transceiver and switch replacements alone-typically costing $200,000-400,000 for a 50-rack facility. Organizations requiring complete recabling face costs of $500,000-800,000 including labor, downtime, and equipment compatibility issues. The $300,000-400,000 differential dwarfs any initial savings from under-specified cabling infrastructure.
Comprehensive TCO modeling reveals that trunk cable selection decisions impact expenses across 7-10 year periods. Organizations should evaluate not just sticker price but installed cost, maintenance burden, and upgrade flexibility to identify truly optimal solutions.
Deployment Strategy and Implementation Framework
Successful trunk cable deployment requires methodical planning that addresses physical installation constraints, testing protocols, and change management considerations. Rushing implementation without adequate preparation consistently produces sub-optimal outcomes regardless of cable quality.
Pre-deployment planning encompasses site surveys, pathway verification, and vendor coordination. Physical site assessment identifies cable routing obstacles including insufficient cable tray capacity, inadequate bend radius clearances, and conflicting pathways. Trunk cables exhibit minimum bend radius specifications-typically 10x cable diameter for OM4 multimode assemblies. A 48-fiber trunk cable with 14mm diameter requires 140mm (5.5 inch) minimum bend radius. Pathways with tighter curves risk fiber damage and performance degradation.
Capacity planning extends beyond fiber count to physical space consumption. A 72-fiber trunk cable occupies substantially more cross-sectional area than six 12-fiber cables carrying equivalent capacity. Cable tray fill calculations must account for total cable bundle diameter to ensure code compliance-typically limiting cable tray fill to 40-50% of available cross-section for thermal management. Organizations should audit existing cable tray utilization and identify required expansions before ordering trunk cables.
Installation execution follows structured workflows that minimize disruption while ensuring quality. Successful implementations deploy trunk cables during designated maintenance windows, establishing complete pathway routing before connecting active equipment. This approach allows thorough testing and troubleshooting without impacting production services. Organizations attempting "hot" installations-connecting trunk cables while networks remain operational-experience significantly higher error rates and extended implementation timelines.
A SaaS company operating a 90-rack facility executed their trunk cable deployment across six planned maintenance windows over three months. Each window addressed a specific building floor, completing all installations and testing before proceeding to the next segment. This phased approach isolated potential issues and allowed course corrections without compromising the entire project. Total implementation completed within planned timeline and budget despite encountering unexpected cable tray capacity issues on floor three-resolved during the interim period between maintenance windows.
Testing protocols verify both physical and optical performance. Tier 1 testing confirms continuity and polarity using visual fault locators and power meters. Tier 2 testing measures insertion loss and return loss using optical loss test sets (OLTS) or optical time domain reflectometers (OTDR). Industry standards specify maximum insertion loss thresholds: 0.75dB for permanent link connections including trunk cables and patch panels. Connections exceeding this threshold require troubleshooting before acceptance.
Documentation during testing creates essential operational records. Each trunk cable should be photographed at installation, tagged with unique identifiers, and recorded in infrastructure management systems. Testing results including insertion loss values, return loss measurements, and polarity verification become baseline references for future troubleshooting. Organizations maintaining rigorous documentation recover from failures 50-60% faster than those relying on institutional knowledge and undocumented configurations.
Change management addresses organizational impacts of infrastructure transitions. Network operations teams require training on trunk cable handling, polarity concepts, and troubleshooting procedures. Many enterprises overlook this human dimension, assuming technical staff will adapt organically. This assumption fails consistently-leading to improper cable handling, connection errors, and degraded performance. Formal training programs covering MTP connector cleaning procedures, proper mating techniques, and polarity verification prevent these common mistakes.
Implementation frameworks balancing technical rigor with operational pragmatism enable successful trunk cable deployments that meet performance objectives, timeline commitments, and budget constraints.
Performance Validation Methods
Validating trunk cable performance extends beyond initial installation testing to encompass ongoing monitoring and periodic re-verification. Organizations establishing comprehensive validation programs detect emerging issues before they impact services while building performance baselines that inform future planning.
Initial acceptance testing employs standardized procedures aligned with TIA-568-C.3 standards for commercial building telecommunications cabling. Testing encompasses four critical measurements: insertion loss, return loss, length verification, and polarity confirmation. Each measurement provides distinct insights into cable quality and installation integrity.
Insertion loss quantifies optical power attenuation through the complete transmission path. Industry-standard maximum thresholds vary by connector type and fiber count: 0.75dB for enterprise-grade permanent links with quality connectors, though individual connections should not exceed 0.35dB. Elevated insertion loss indicates potential problems including contaminated connectors, excessive bend radius violations, or manufacturing defects. Organizations should establish baseline insertion loss values for each trunk cable during installation, enabling trend analysis over time.
Return loss measures back-reflected optical power resulting from impedance mismatches at connection points. Poor return loss degrades system performance even when insertion loss remains acceptable. Minimum return loss specifications typically require ≥20dB for multimode systems and ≥26dB for singlemode applications. Return loss failures most commonly result from contaminated or damaged connector end-faces. Proper cleaning protocols using IPA (isopropyl alcohol) and lint-free wipes resolve 90% of return loss issues.
Length verification using OTDR testing confirms actual installed cable length against specifications. Length discrepancies indicate potential problems including wrong cable installation (mix-ups during deployment) or damage during installation. This measurement also provides visual signatures of connection quality through reflection analysis-skilled technicians identify potential connector problems from OTDR trace characteristics.
Ongoing performance monitoring establishes trend baselines detecting gradual degradation before failures occur. Organizations implementing quarterly insertion loss testing across critical trunk cables identify issues averaging 6-9 months before catastrophic failures. This early warning enables planned maintenance during scheduled windows rather than emergency responses during business hours.
Monitoring programs should prioritize high-utilization trunk cables supporting business-critical applications. A 48-fiber trunk cable carrying financial trading system connectivity warrants more frequent testing than cables serving administrative networks. Risk-based monitoring allocation optimizes resource deployment while ensuring adequate coverage of critical infrastructure.
Thermal imaging surveys supplement optical testing by identifying physical installation problems affecting performance. Infrared cameras detect hot spots indicating excessive optical power absorption-often resulting from contaminated connectors or damaged fibers. Thermal surveys also reveal cable compression issues and inadequate airflow that accelerate cable degradation. Organizations conducting annual thermal surveys identify problems averaging 40% earlier than those relying solely on optical testing.
Validation programs combining multiple testing methodologies create comprehensive performance baselines while detecting emerging issues before they impact operations. These programs transform infrastructure management from reactive troubleshooting to proactive maintenance-reducing downtime frequency and duration.

Frequently Asked Questions
How do I determine the appropriate fiber count for my enterprise environment?
Calculate current fiber consumption by documenting all active connections, then apply 50% growth projection over your planning horizon (typically 3-5 years). Add 20% overhead for redundancy. For example, if current utilization is 800 fibers with projected 50% growth, total requirement equals 800 × 1.5 × 1.2 = 1,440 fibers. This calculation should inform trunk cable selection, typically rounding up to standard fiber counts (12, 24, 48, 72).
Should enterprises deploy multimode or singlemode trunk cables?
Deployment context determines fiber mode selection. Multimode OM4 or OM5 serves most intra-building applications with distances under 150 meters at 100G speeds, offering lower transceiver costs ($300-500 per port versus $1,200-2,000 for singlemode). Singlemode OS2 becomes necessary for inter-building campus connectivity, transmission distances exceeding 500 meters, or long-term flexibility supporting future 800G+ speeds. Many enterprises deploy mixed configurations using singlemode for backbone infrastructure and multimode for distribution.
What is the cost difference between MTP Elite and standard MPO connectors?
MTP Elite connectors typically cost $18-25 per termination compared to $12-18 for standard MPO connectors-representing 30-40% premiums. For a 100-cable deployment (200 connectors), this differential equals $1,200-1,400. Organizations should evaluate this cost against performance requirements and link budget analysis. Applications approaching optical power budget limits benefit from Elite connector lower insertion loss (0.25dB versus 0.35dB), while less demanding applications can deploy standard MPO cost-effectively.
How often should enterprises re-test trunk cable performance?
Establish tiered testing schedules based on cable criticality. Critical infrastructure supporting business-essential applications warrants quarterly optical testing, while standard deployments require annual verification. All trunk cables should undergo testing after any physical disturbance including cable tray modifications, adjacent construction, or equipment installations. Additionally, perform testing when troubleshooting connectivity issues or before major equipment upgrades to establish known-good baselines.
Can existing 12-fiber trunk cables be upgraded to support higher speeds?
Existing trunk cables support speed upgrades if the underlying fiber mode meets new application requirements. OM4 multimode trunk cables deployed for 40G connectivity readily support 100G upgrades through transceiver replacements alone. However, upgrading from 100G to 400G may require cable replacement if existing cables are OM3 fiber-which limits 400G transmission to 70 meters. Review fiber mode specifications and required distances before committing to in-place upgrades versus cable replacement.
Key Takeaways
Enterprise fiber density requirements have increased 330% between 2020-2024, driven by AI workloads and cloud adoption, making trunk cable selection critical for avoiding premature capacity constraints and costly mid-lifecycle recabling.
Total cost of ownership analysis consistently favors pre-terminated trunk cables over field-terminated solutions, with installation labor savings of $26,000-69,000 for typical 100-cable deployments offsetting higher material costs.
Fiber count selection should account for 50% compound growth over 3-5 year planning horizons, with 20% additional overhead for redundancy-preventing the common mistake of under-provisioning based solely on current requirements.
Compatibility specifications including fiber mode, polarity type, and connector grade directly impact performance and upgrade flexibility, with mismatches creating complete connection failures or subtle degradation that manifests only under peak load conditions.